Modern delivery organisations operate in systems shaped by uncertainty, constrained resources, shifting priorities, dependencies, interruptions, and throughput variability.
Yet many planning tools still present delivery as though it were predictable:
- fixed delivery dates
- stable team capacity
- fixed task durations
- linear execution paths
- predictable dependency chains
The Work Simulator was designed to challenge that assumption.
Rather than treating planning as a static scheduling exercise, it models delivery as a probabilistic, constrained, interconnected system. It combines Monte Carlo simulation, systems thinking, operational flow modelling, Theory of Constraints principles, and AI-assisted interpretation.
The core idea is simple:
Delivery systems are not deterministic machines. They are adaptive systems operating under uncertainty.
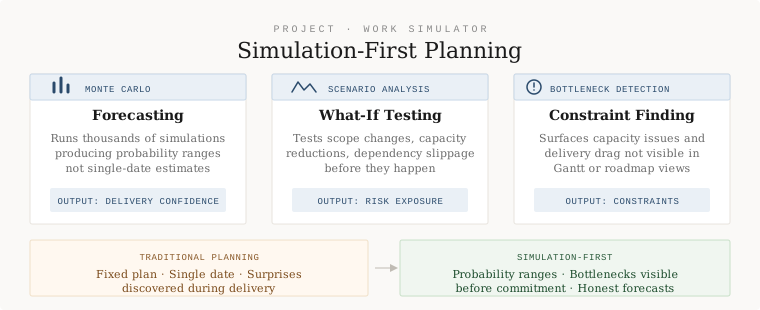
The Problem
Traditional planning tools often simplify reality to create a sense of certainty.
Spreadsheets, Gantt charts, and roadmap tools are useful, but they can encourage a misleading view of delivery. They often assume that work moves cleanly from one step to another, that capacity is stable, and that dependencies behave predictably.
Real delivery rarely behaves like that.
A delayed dependency can cascade across several teams. A constrained specialist can become the bottleneck for an entire programme. Increasing utilisation can create more queues, more waiting time, and slower overall flow.
This is the central planning problem the Work Simulator is designed to expose.
It shifts planning away from this:
flowchart LR
    A[Task A] --> B[Task B] --> C[Task C] --> D[Delivery Date]
    classDef simple fill:#f5f5f5,stroke:#999,color:#111;
    class A,B,C,D simple;
And towards this:
flowchart TD
    P[Priorities Change] --> W[Work Queue]
    C[Team Capacity] --> W
    D[Dependencies] --> W
    I[Interruptions] --> W
    W --> T1[Team 1]
    W --> T2[Team 2]
    W --> T3[Specialist Team]
    T1 --> O[Forecast Outcome]
    T2 --> O
    T3 --> O
    O --> R[Risk / Confidence / Delay]
    R --> P
    classDef system fill:#eef6ff,stroke:#2563eb,color:#111;
    classDef risk fill:#fff7ed,stroke:#f97316,color:#111;
    class P,W,C,D,I,T1,T2,T3,O system;
    class R risk;
The product does not simply sequence tasks on a timeline. It models operational flow.
Current Product Approach
The current version of the Work Simulator is deliberately functional rather than polished.
At this stage, it does not have a dedicated user interface. The application is operated through a Swagger front end, with the main focus on proving the simulation model, validating the data structure, and calculating the forecast outputs correctly.
That is a conscious product decision.
The first priority is not to build a beautiful interface. The first priority is to prove that the underlying model can represent real delivery conditions: work items, teams, capacity, dependencies, estimates, queues, and probabilistic outcomes.
The product is also deliberately Excel-driven at this stage.
That reflects how most operational planning still happens in reality. Delivery teams, project managers, PMOs, product teams, and operational planners often use spreadsheets because they are familiar, flexible, quick to change, and easy to share.
Excel has several practical advantages for this type of product:
- Low adoption friction — users do not need to learn a new planning interface before they can test the model.
- Fast data entry — teams can create, copy, paste, edit, and bulk-update work items much faster than they could through an early-stage UI.
- Familiar mental model — most planning users already understand rows, columns, sheets, filters, formulas, and basic validation.
- Easy scenario creation — users can duplicate a workbook, change capacity, alter estimates, amend dependencies, and rerun a different scenario.
- Transparent inputs — the model is easier to challenge because the source data is visible, editable, and auditable.
- Operational portability — exported results can be reused in other tools, including Microsoft Project, reporting packs, portfolio dashboards, or internal planning documents.
- Simple collaboration — spreadsheets can be reviewed by stakeholders who may never log into the simulator itself.
- Good fit for early validation — Excel allows the product to test whether the simulation logic is valuable before investing heavily in workflow screens, dashboards, or a full planning UI.
This does not mean the product is intended to become an Excel tool forever. It means Excel is currently the most practical interface for proving the model and getting realistic planning data into the system quickly.
The simulator can import structured planning data from Excel, calculate deterministic and probabilistic forecasts, and export results back into spreadsheet formats that users can analyse, challenge, share, or import into other planning tools.
This is also an important product boundary: the Work Simulator is not intended to become a project management tool.
It is not trying to replace Jira, Monday.com or MS Project , it is designed to work in conjunction with them
Product Philosophy
The Work Simulator is influenced by several complementary ideas from systems thinking, operational research, and probabilistic forecasting.
Eliyahu Goldratt’s Theory of Constraints is central to the product logic. Systems are governed by their constraints, not their averages. A single overloaded team, scarce specialist, or blocked dependency can shape the performance of the whole delivery system.
Systems thinkers such as Donella Meadows, Peter Senge, and Michael C. Jackson also inform the approach. Delivery environments contain feedback loops, delays, local optimisation problems, changing capacity, and emergent behaviour.
This matters because traditional planning often optimises the wrong thing.
Keeping every team fully utilised may look efficient, but it can make the system slower. High utilisation creates queues. Queues create waiting time. Waiting time increases delivery risk.
The Work Simulator therefore focuses on flow rather than utilisation.
It models:
- constrained resources
- team queues
- dependency propagation
- parallel execution limits
- work-in-progress constraints
- throughput variability
- changing capacity over time
The aim is not to predict the future perfectly.
The aim is to make uncertainty visible enough to support better decisions.
Why Monte Carlo Simulation?
The simulation engine uses Monte Carlo methods, originally developed by Stanislaw Ulam and John von Neumann during the Manhattan Project to model uncertainty in complex systems.
Instead of relying on one fixed delivery estimate, the simulator repeatedly samples likely task durations and operational constraints. This produces a distribution of possible outcomes rather than a single date.
That distinction is important.
A deterministic plan asks:
When will this finish?
A probabilistic forecast asks:
How confident are we that this will finish by a given date?
The simulator supports probability distributions such as:
- PERT distributions
- triangular distributions
These allow each work step to be modelled using optimistic, most likely, and pessimistic estimates.
flowchart LR
    A[Optimistic Duration] --> D[Probability Distribution]
    B[Most Likely Duration] --> D
    C[Pessimistic Duration] --> D
    D --> S[Monte Carlo Sampling]
    S --> R[Forecast Distribution]
    R --> P50[P50]
    R --> P80[P80]
    R --> P90[P90]
    R --> W[Worst Case]
    classDef input fill:#ecfeff,stroke:#0891b2,color:#111;
    classDef process fill:#eef2ff,stroke:#4f46e5,color:#111;
    classDef output fill:#f0fdf4,stroke:#16a34a,color:#111;
    class A,B,C input;
    class D,S,R process;
    class P50,P80,P90,W output;
This makes the simulator suitable for delivery environments where uncertainty compounds across teams, dependencies, and queues.
How the Simulator Works
The Work Simulator models delivery as a set of work items, team steps, dependencies, and capacity constraints.
Each work item can contain one or more execution steps. Each step belongs to a team and can depend on other steps being completed first.
The simulator then calculates how work moves through the system under deterministic or probabilistic conditions.
flowchart TD
    WI[Work Item] --> S1[Step 1: Analysis]
    WI --> S2[Step 2: Engineering]
    WI --> S3[Step 3: QA]
    WI --> S4[Step 4: Release]
    S1 --> S2
    S2 --> S3
    S3 --> S4
    T1[Analysis Team Capacity] --> S1
    T2[Engineering Capacity] --> S2
    T3[QA Capacity] --> S3
    T4[Release Capacity] --> S4
    classDef work fill:#f8fafc,stroke:#64748b,color:#111;
    classDef step fill:#eef6ff,stroke:#2563eb,color:#111;
    classDef team fill:#f0fdf4,stroke:#16a34a,color:#111;
    class WI work;
    class S1,S2,S3,S4 step;
    class T1,T2,T3,T4 team;
The simulation engine considers:
- task duration estimates
- dependency rules
- team capacity
- queue order
- productivity factors
- concurrency limits
- working-day rules
- simulation iteration count
- chosen probability distribution
This allows the product to show not only when work might complete, but why a forecast changes.
Core Product Concepts
Work Items
A work item represents a deliverable unit of activity.
Examples include:
- features
- operational initiatives
- implementation tasks
Each work item can contain multiple team-based steps.
Work Team Steps
A work team step represents a piece of work assigned to a specific team.
Each step can include:
- optimistic duration
- most likely duration
- pessimistic duration
- assigned team
- prerequisite dependencies
- concurrency constraints
This allows the simulator to represent real delivery flow across multiple teams rather than treating work as a single fixed-duration task.
Teams
Teams represent execution groups such as:
- product
- analysis
- engineering
- architecture
- QA
- operational support
- implementation
Each team can have capacity limits, productivity factors, queue ordering, and availability settings.
Capacity Periods
Capacity periods allow the simulator to represent changing operational conditions over time.
Examples include:
- team growth
- holidays
- reduced availability
- temporary disruption
- planned capacity increases
- productivity changes
This is important because delivery capacity is rarely static across the full life of a programme.
Dependencies
Dependencies define the order in which work can proceed.
The simulator dynamically resolves:
- prerequisite work
- blocked execution
- sequencing constraints
- cross-team dependencies
- downstream impact
This allows dependency chains to influence the forecast realistically.
Simulation Flow
At a high level, the simulator follows this process:
flowchart TD
    A[Import or Create Work Items] --> B[Validate Teams, Steps, Durations and Dependencies]
    B --> C[Build Simulation Model]
    C --> D{Simulation Type}
    D -->|Deterministic| E[Use Fixed Durations]
    D -->|Monte Carlo| F[Run Multiple Iterations]
    F --> G[Sample Step Durations]
    G --> H[Resolve Dependencies]
    H --> I[Apply Team Capacity and Queue Rules]
    I --> J[Calculate Completion Dates]
    J --> K[Aggregate Results]
    E --> H
    K --> L[Generate Forecast Outputs]
    L --> M[Export Results]
    L --> N[AI-Assisted Summary]
    classDef input fill:#ecfeff,stroke:#0891b2,color:#111;
    classDef decision fill:#fef9c3,stroke:#ca8a04,color:#111;
    classDef process fill:#eef2ff,stroke:#4f46e5,color:#111;
    classDef output fill:#f0fdf4,stroke:#16a34a,color:#111;
    class A,B input;
    class D decision;
    class C,E,F,G,H,I,J,K process;
    class L,M,N output;
This structure supports both simple deterministic modelling and richer probabilistic simulation.
Forecast Outputs
The simulator generates confidence-based outputs rather than a single delivery answer.
| Output | Meaning |
|---|---|
| Deterministic | Result using fixed durations |
| P50 | 50% confidence forecast |
| P80 | 80% confidence forecast |
| P90 | 90% confidence forecast |
| Best Case | Fastest plausible outcome |
| Worst Case | Highest-risk outcome |
This allows stakeholders to compare optimistic, typical, and risk-adjusted delivery scenarios.
The value is not just in the dates themselves. The value is in the spread between them.
A narrow spread suggests a more stable forecast. A wide spread suggests greater uncertainty, higher sensitivity to disruption, or a system that is strongly affected by bottlenecks and dependencies.
xychart-beta
    title "Example Forecast Spread"
    x-axis ["Best Case", "P50", "P80", "P90", "Worst Case"]
    y-axis "Completion Days" 0 --> 120
    bar [42, 58, 74, 86, 108]
This is where probabilistic forecasting becomes more useful than red, amber, and green reporting.
The better question is not:
Is the project on track?
The better question is:
What confidence do we have, and where is that confidence fragile?
Bottlenecks and Flow
The Work Simulator is deliberately designed around flow.
In delivery systems, the slowest or most constrained part of the system often governs the performance of the whole. This is why the Theory of Constraints is so relevant.
The simulator can help identify where risk is accumulating:
- overloaded teams
- scarce specialist roles
- long queues
- blocked dependencies
- over-parallelised work
- unstable capacity
- excessive work in progress
flowchart LR
    A[Incoming Work] --> B[Analysis Queue]
    B --> C[Engineering Queue]
    C --> D[QA Queue]
    D --> E[Release]
    C --> X[Bottleneck: Limited Engineering Capacity]
    X --> C
    classDef normal fill:#f8fafc,stroke:#64748b,color:#111;
    classDef bottleneck fill:#fee2e2,stroke:#dc2626,color:#111;
    class A,B,C,D,E normal;
    class X bottleneck;
The product is not just asking whether a team is busy.
It is asking whether the system is flowing.
That distinction matters. A fully utilised system can still be a poorly performing system.
AI-Assisted Interpretation
The Work Simulator treats AI as an interpretation layer rather than an autonomous decision-maker.
AI can help explain:
- what the simulation results mean
- which teams appear to be bottlenecks
- where delivery risk is concentrated
For example, an AI-generated summary could explain that the P90 forecast is being driven by dependency delays in QA, or that the forecast spread has widened because a specialist team is over capacity during a critical period.
The intended AI role is:
flowchart TD
    A[Simulation Results] --> B[Structured Metrics]
    A --> C[Forecast Spread]
    A --> D[Bottleneck Signals]
    A --> E[Dependency Risk]
    B --> F[AI Interpretation Layer]
    C --> F
    D --> F
    E --> F
    F --> G[Plain-English Summary]
    F --> H[Risk Explanation]
    F --> I[Mitigation Options]
    F --> J[Stakeholder Narrative]
    classDef data fill:#ecfeff,stroke:#0891b2,color:#111;
    classDef ai fill:#f5f3ff,stroke:#7c3aed,color:#111;
    classDef output fill:#f0fdf4,stroke:#16a34a,color:#111;
    class A,B,C,D,E data;
    class F ai;
    class G,H,I,J output;
The intention is not to replace human judgement.
The intention is to improve interpretation, visibility, and decision quality.
AI-generated outputs should remain:
- explainable
- traceable
- grounded in simulation results
- subject to human review
Technical Architecture
The current platform is built around a Spring Boot backend.
Core technologies include:
- Java 21
- Spring Boot
- REST APIs
- Hibernate / JPA
- H2 for local development
- PostgreSQL as a future production database
- Excel import/export tooling
The simulation layer is responsible for:
- probabilistic execution
- dependency resolution
- queue handling
- resource scheduling
- statistical aggregation
- forecast output generation
A simplified architecture looks like this:
flowchart TD
    U[User] --> UI[Web UI / API Client]
    UI --> API[Spring Boot REST API]
    API --> V[Validation Layer]
    API --> S[Simulation Service]
    API --> I[Import / Export Service]
    V --> DB[(Database)]
    I --> DB
    S --> DB
    S --> E[Simulation Engine]
    E --> R[Result Aggregator]
    R --> DB
    R --> X[Excel / CSV Export]
    R --> A2[AI Summary Service]
    A2 --> N[Human-Readable Insight]
    classDef user fill:#f8fafc,stroke:#64748b,color:#111;
    classDef app fill:#eef2ff,stroke:#4f46e5,color:#111;
    classDef db fill:#fef9c3,stroke:#ca8a04,color:#111;
    classDef output fill:#f0fdf4,stroke:#16a34a,color:#111;
    class U,UI user;
    class API,V,S,I,E,R,A2 app;
    class DB db;
    class X,N output;
Future architecture could include:
- asynchronous processing
- portfolio-level forecasting
Product Trade-Offs
Accuracy vs Performance
Higher iteration counts improve statistical confidence but increase execution time.
For small models, this may not matter. For larger portfolios with many dependencies and teams, performance becomes a serious product consideration.
Simplicity vs Realism
More realistic modelling creates better forecasts but increases configuration complexity.
The product needs to balance modelling power with usability. If users need to configure too much before getting value, the model becomes operationally expensive.
Precision vs Explainability
Sophisticated models are only useful if stakeholders can understand them.
A forecast that is mathematically impressive but impossible to explain is weak from a product perspective. The simulator therefore needs to show not only the result, but the reasoning behind the result.
Flexibility vs Usability
The simulator needs enough flexibility to model real delivery environments without becoming a specialist-only tool.
This is a core product challenge: powerful enough for complex operational planning, but simple enough to be usable by delivery teams, product teams, and business stakeholders.
Key Features
The platform supports, or is intended to support:
- deterministic simulation
- Monte Carlo simulation
- dependency-aware scheduling
- constrained resource modelling
- team capacity modelling
- concurrency limitations
- Excel imports and exports
- percentile forecasting
- bottleneck identification
- scenario comparison
- AI-generated insight summaries
Future Roadmap
Potential future capabilities include:
- statistical analysis across scenarios
- richer scenario comparison
- automated mitigation recommendations
- bottleneck heatmaps
- confidence trend analysis
- operational digital twin modelling
- what-if scenario planning
- integration with product and delivery tooling
A possible roadmap structure:
timeline
    title Work Simulator Roadmap
    section Foundation
        Core domain model : Work items, teams, steps and dependencies
        Deterministic simulation : Fixed-duration forecasting
        Excel import/export : Operational data entry and reporting
    section Probabilistic Forecasting
        Monte Carlo engine : P50, P80, P90 and worst-case outcomes
        Distribution support : PERT and triangular modelling
        Forecast exports : Summary sheets and Gantt-style outputs
    section Decision Support
        Bottleneck detection : Team and dependency risk signals
        Scenario comparison : Compare capacity and sequencing options
        AI summaries : Plain-English interpretation of results
    section Advanced Planning
        Portfolio simulation : Multi-programme forecasting
        Digital twin modelling : Operational system representation
        Mitigation recommendations : Suggested interventions and trade-offs
Strategic Positioning
The Work Simulator sits at the intersection of:
- operational planning
- probabilistic forecasting
- systems thinking
- AI-assisted decision support
- delivery intelligence
Unlike traditional project management tools, it does not assume that operational systems are predictable.
It assumes they are:
- adaptive
- constrained
- interconnected
- probabilistic
- continuously evolving
This changes how forecasting, planning, and delivery risk are understood.
The product is not positioned as another task tracker. It is closer to a decision-support layer for complex delivery environments.
It helps answer questions such as:
- Where is risk building?
- Which team is constraining flow?
- How confident are we in the current forecast?
- What happens if capacity changes?
- Which dependencies are driving delay?
- What is the difference between a likely outcome and a risk-adjusted outcome?
What I Learned
Building the simulator reinforced several product lessons.
First, deterministic plans often create false confidence. A single date may be easy to communicate, but it can hide the real risk in the system.
Second, bottlenecks matter more than averages. A plan can look achievable at a high level while still being blocked by one constrained team or dependency chain.
Third, uncertainty should be visible. Hiding uncertainty does not remove it. It simply makes the organisation less prepared.
Fourth, local optimisation can damage global flow. Keeping every team busy is not the same as improving delivery performance.
Fifth, AI is most valuable when it improves interpretation. The strongest use case is not replacing judgement, but helping people understand complex results faster.
Finally, technical modelling and product thinking are stronger together. The modelling engine matters, but the product value comes from helping users make better decisions.
Conclusion
The Work Simulator is based on a simple product belief:
Operational delivery should be modelled as a system, not reduced to a static schedule.
By combining Monte Carlo simulation, systems thinking, Theory of Constraints, probabilistic forecasting, and AI-assisted analysis, the platform provides a more realistic way to understand delivery confidence and operational risk.
The goal is not simply to create better plans.
The goal is to help teams see the system they are operating in, understand where risk is building, and make better decisions before delivery problems become visible too late.